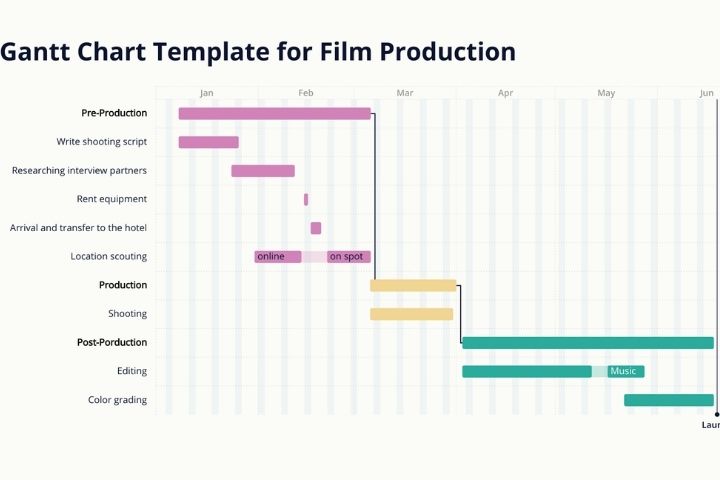
A Gantt chart is a useful tool for planning projects. By providing you with an overview of scheduled tasks , all parties involved will know which tasks have to be completed and by what date .
Table of Contents
Advantages Of A Gantt Chart
Using a Gantt chart in your project management process provides you with the following benefits:
- Clarity
- A simplified overview
- Performance data
- Better time management
- Flexibility
Clarity
A Gantt chart breaks down multiple tasks and timelines into a single overview. This way, you know where your team is in each phase of the project . Use the diagram to show stakeholders how the tasks are organized and what resources are allocated to each of them . This way, you can clearly present to them where you are in the project and if it will be completed successfully.
Communication
Teams use Gantt charts to replace meetings and status updates. This way, team members will have a clear overview of the progress of each task .
Motivation
By creating a clear overview, team members are more aware of their overall performance and will be able to tailor their work routine based on the needs of the project schedule. In addition, they will be more aware of interdependent tasks, and therefore better understand the impact of delays within the project . This type of planning encourages collaboration and better organization of tasks.
Time management
Gantt charts help you set realistic timelines . The bars in the diagram indicate in which period a certain task has to be completed. In this way, you will ensure that you do not harm other projects that require more resources and time.
Flexibility
Projects often undergo modifications. By having an overview of unexpected changes within a project’s goals or timelines, you can adjust tasks and resources accordingly .
Disadvantages Of Gantt Charts
Complexity
Projects that consist of a large number of tasks and resources can result in very complex Gantt charts, especially if you are working on a large project or have a very large team. Representing dozens or even hundreds of tasks on a Gantt chart can be confusing or difficult to read. Therefore, it is essential to assess the different tasks and subtasks before diagramming and assigning someone to keep track of the details .
Chronological linearity
For a Gantt chart to be effective you must plan your project linearly from beginning to end. So you must know in advance the result and the steps that lead to that result before starting. This may sound quite obvious when building a house, for example, but it is much more complicated when it comes to web developers dedicated to a project where the client has not specified the final result.
Hard work
As we mentioned before, projects change. If you are using a Gantt chart, you have to adapt it accordingly. The responsible project manager has to update the diagram frequently , although this task can be simplified with the help of a project management program.
How To Create A Gantt Chart?
To create your first Gantt chart, follow the process below:
Make a list of all the tasks
Write down all the tasks that need to be completed to finish the project successfully. You should also include deadlines and responsible team members.
For example, if you are redesigning a website, a large “activity” would include creating a series of mockups in Photoshop.
In turn, this activity can be broken down into several tasks:
- Create wireframes
- Review the usability performance of wireframes
- Create mockups with the best performing wireframes
- Create a prototype from the mockup
- Do usability tests
- Review and authorize the best performing prototypes for development

